1. Transcriptome
Bulk RNA-seq or microarray expression data from disease, control and treated samples form the starting matrix.
Input: expression matrix (genes × samples).
The platform turns whole-transcriptome data into a compact image and two quantitative scores: how far disease has moved a cell's gene network, and how far an intervention moves it back.
The same method runs on public repositories (GEO, TCGA, Connectivity Map) and on partner datasets, so discovery work can start before any new experiment is commissioned.

Bulk RNA-seq or microarray expression data from disease, control and treated samples form the starting matrix.
Input: expression matrix (genes × samples).
PRCA computes r 2 for gene pairs across samples and groups co-expressed genes into metabolon modules. Each module is marked active or inactive and mapped into a 9 × 9 grid.
Output: RNA QR code (RQC) with >80 modules.
Modules that change between healthy and disease samples contribute to the Disruption Index (TI). Modules that move back toward the healthy pattern under an intervention contribute to the Restoration Index (RI).
TI = disrupted modules
/ tracked modules.
RI = restored modules
/ disrupted modules.
Illustrative example; real codes track more than 80 modules. TI, originally called the Tumor Index, is read as a disruption index outside oncology.
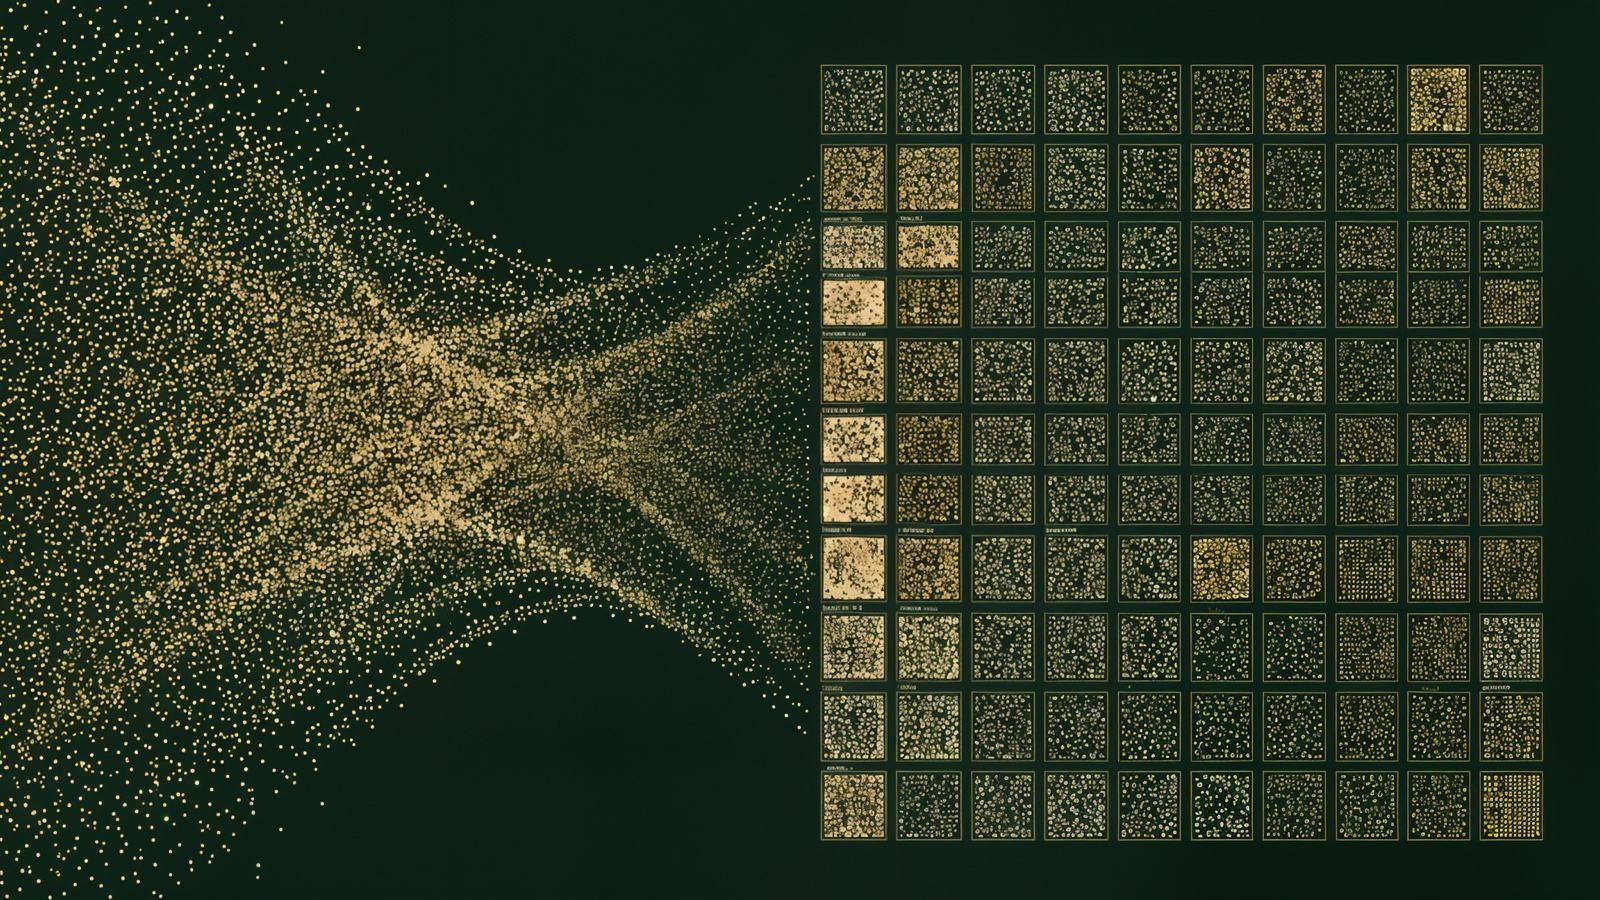
This is not strictly a pharmaceutical platform. The code does not know whether a compound is synthetic or natural; it scores the network effect, on one scale, so the evidence stands on its own.
The platform reads the transcriptome, not the label. Pharmaceutical compounds, botanical extracts and natural products are all scored by their effect on the same network.
Validation here means measurement: how much an intervention restores disrupted modules in a defined model. It is not an endorsement of safety, nor of clinical efficacy.
Research-stage; not reviewed by the FDA.

RNA QR codes form a platform, not a single-indication assay. Every approved drug can be re-scored where quality transcriptome data exists.
Use pre-treatment RNA QR codes to identify likely responders and enrich trials for those patients, reducing noise and wasted spend.
Apply multiple candidates to a model, compute RI for each and rank by restoration score instead of waiting for long survival endpoints.
Compare a disease RNA QR code to a library of drug-response QR codes. High similarity suggests similar network effects and identifies candidates for follow-up.
For a given patient, match the tumor QR code to interventions whose response codes best counteract the disrupted modules, subject to standard-of-care and safety constraints.
Regenerate the QR code after each treatment cycle; track RI over time to see whether the network is being durably restored or drifting toward resistance.
AlphaExpression is the cloud environment where PRCA computations, QR code generation and TI/RI analytics run. It is designed for research teams and contract labs.
Early-access collaborations are available for oncology, autoimmunity and neuroscience programs.
Contact: [email protected]