RQC
RNA QR code
A binary matrix encoding active and inactive metabolon modules from Pairwise RNA Co-expression Analysis (PRCA). Each code is a systems-level fingerprint of a biological state; more than 80 modules are tracked.
Transcriptomic biomarkers for drug discovery, clinical trial enrichment and precision oncology. One image per sample. Two scores: how far disease has moved a cell's gene network, and how far an intervention moves it back toward healthy.
Patient heterogeneity dilutes efficacy signals. Single-gene biomarkers miss network-level biology. Pharma needs systems-level patient stratification, and it does not have it.
"A drug effective only in a subset of patients may fail a trial entirely if responders are not prospectively identified."
90% figure: Sun et al., Acta Pharmaceutica Sinica B (2022). 1-in-400 figure: Younis et al., Sci Transl Med (2025).
About 20,000 genes are condensed into 80+ functional modules (co-expressed gene groups Dr. Ji calls metabolons). Each sample becomes one visual code — an RNA QR code — and is scored two ways: how broken the network is, and how well an intervention repairs it.
A binary matrix encoding active and inactive metabolon modules from Pairwise RNA Co-expression Analysis (PRCA). Each code is a systems-level fingerprint of a biological state; more than 80 modules are tracked.
The fraction of metabolon networks dysregulated versus normal. Higher TI means greater disease disruption. Inside oncology it is read as a tumor index; outside it, as a disruption index.
The percentage of disrupted modules an intervention returns toward their healthy state. A single score that ranks candidates head-to-head and predicts patient response.
Illustrative example; real codes track 80+ modules.
Compute r² for all gene pairs across samples. Retain pairs above threshold. Cluster into metabolon modules.
Identify groups of metabolons whose expression correlates linearly across patients.
Active metabolons become dark modules, inactive ones light. The 2-D matrix is a compact fingerprint of network state.
TI = disrupted ÷ total modules. RI = restored ÷ disrupted. Objective, quantitative, comparable across drugs and patients.
Because the scores run on transcriptome data, approved drugs and natural compounds can be re-scored against diseases that already have public expression data, before new trials are planned. The full method is on the Platform page.
Retrospective analyses of public datasets show the scores separate survival groups and quantify drug effect — on data that already exists, with no new patients and no lab costs.
Pre-treatment RNA QR codes distinguished longer- from shorter-survival groups in a retrospective look at public data, and the method quantified how many disrupted modules the drug restored.
A single frozen restoration index — one formula, one module definition, code anyone can rerun — is in preparation. Headline percentages are withheld until the method is frozen and preregistered.
Across normal and tumor prostate tissue the method quantified both how much the tumor state disrupted the normal network and how much the therapy restored it.
Final indices await the frozen protocol and an independent rerun, so every number stays reproducible.
These are computational analyses of existing public data. They have not been prospectively validated and are not evidence of clinical efficacy. The next step, now underway, is pre-registered analysis of Epstein–Barr virus (EBV) disease, with success criteria fixed in advance.
Full figures and methods are summarised on the Evidence page.
Retrospective analyses of public datasets (GEO, TCGA). Preliminary; not reviewed by the FDA. Prior results do not guarantee future outcomes.
The Restoration Index asks one question of any intervention: how many of the modules that disease disrupted have returned to their healthy state. The answer comes from the transcriptome itself, in the language of the cell. A pharmaceutical, a botanical extract and a natural compound are read by the same code, scored on the same scale, and pass or fail by the same biology. There is no separate standard for natural compounds and no separate standard for drugs.
The transcriptome of the disease model before and after the intervention, from RNA-seq or microarray.
The RNA QR code is generated by the same PRCA method regardless of what was applied; the compound never enters the calculation.
RI = restored ÷ disrupted modules. A drug and a natural compound compared head-to-head on one axis.
Validation is a measurement, not an endorsement. The indices measure network change in transcriptome data; they are not clinical outcomes, and the platform does not diagnose or treat any condition.
The RNA QR code is a platform, not a single-indication assay. Every approved drug can be re-scored.
Pre-screen patients by RNA QR code and enroll only predicted responders — raising efficacy signal and reducing wasted spend.
Apply candidates to models, compute RI for each, and rank by restoration score without waiting for survival endpoints.
Compare a candidate's code to known drugs. High similarity suggests similar effect. Screen entire libraries for unexpected agents.
Match each patient's tumor code to the drug whose code best counteracts it — lock-and-key precision at the network level.
Re-generate the code after each cycle, track RI over time, and detect resistance early.
PRCA computation, QR code generation and TI/RI analytics for academic and industry research teams, with an API for CRO and pharma integration.
Stanford's recent work shows Epstein–Barr virus turning a small share of B cells into network-level drivers of lupus: a cascade our method is built to read.
The first three analyses are specified in advance and run on public data only. Details live on the EBV program page.
Existing network and genomic tools either lack a unifying visual code, do not provide a drug-response index, or focus on single pathways. The RNA QR code integrates discovery, stratification and monitoring into one system.
Captures network-wide co-expression across 80+ metabolon modules, rather than resting on any individual mutation or protein biomarker.
TI and RI convert qualitative differences into objective numbers, so candidates are ranked head-to-head and patients scored on one framework.
Early evidence in breast and prostate cancer; the approach extends to autoimmune and CNS indications and to non-genomic modalities such as EEG and proteomics.
A provisional patent (January 2026) covers the PRCA method, RNA QR code generation, the TI/RI metrics, trial enrichment and companion diagnostics.
Cell language theory holds that cells communicate using molecules as words, and that genetic information exists in two forms — DNA carrying it in time, RNA expression profiles carrying it in space. The RNA QR code reads that spatial information directly. RNAscopy, Dr. Ji's term, is the clinical practice built on it.
The full archive of publications, talks and personal writing is maintained at The Human RNA Project, and on the Science page.

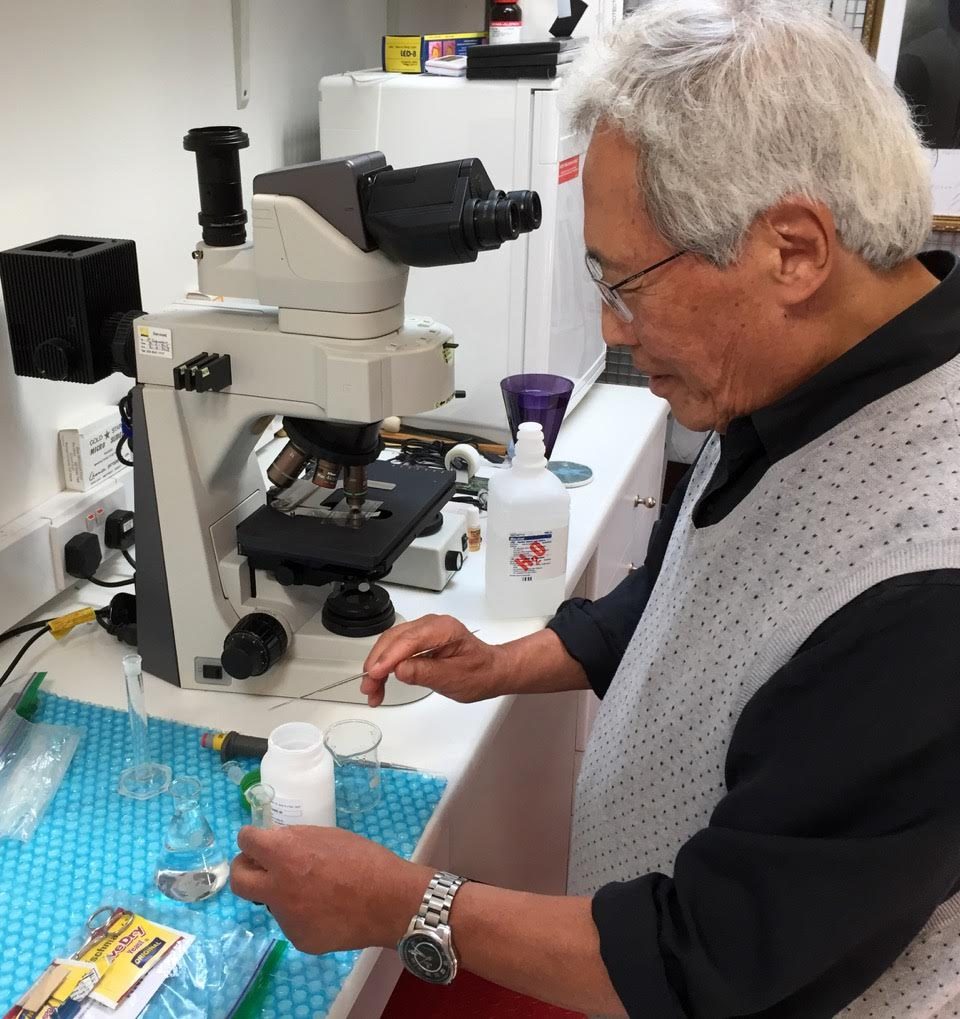
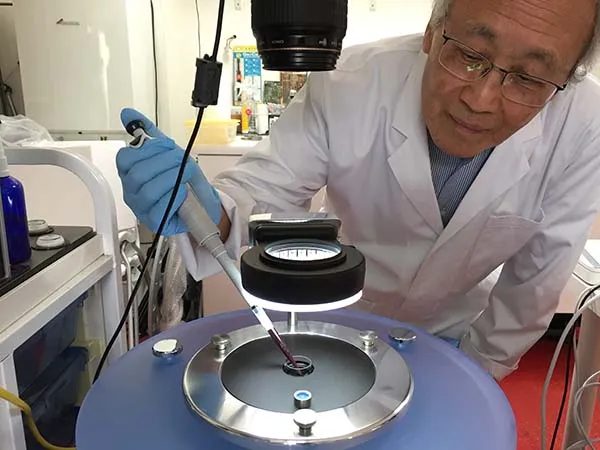
Chief Scientific Officer; scientific founder and inventor. Professor Emeritus, Theoretical Cell Biology, Rutgers University. Originator of the conformon, cell language theory, PRCA methodology and RNA QR codes. Full archive at sungchulji.com.

Special Adviser for Complex Systems and Values-Based Strategy. Pro bono strategic counsel and honorary member, Embassy of Peace, Whitianga, New Zealand. Serving in friendship, trust, and a shared commitment to peace.
We are hiring a computational biologist and patent counsel, and advisory seats are open in immunology and biostatistics. Biographies and roles are detailed on the Leadership page.
For scientific collaborations, CRO and pharma partnerships, press and qualified investors.
[email protected]
X @Bioceuticalsai
Investor materials are available to accredited investors on request via the Investors page.